
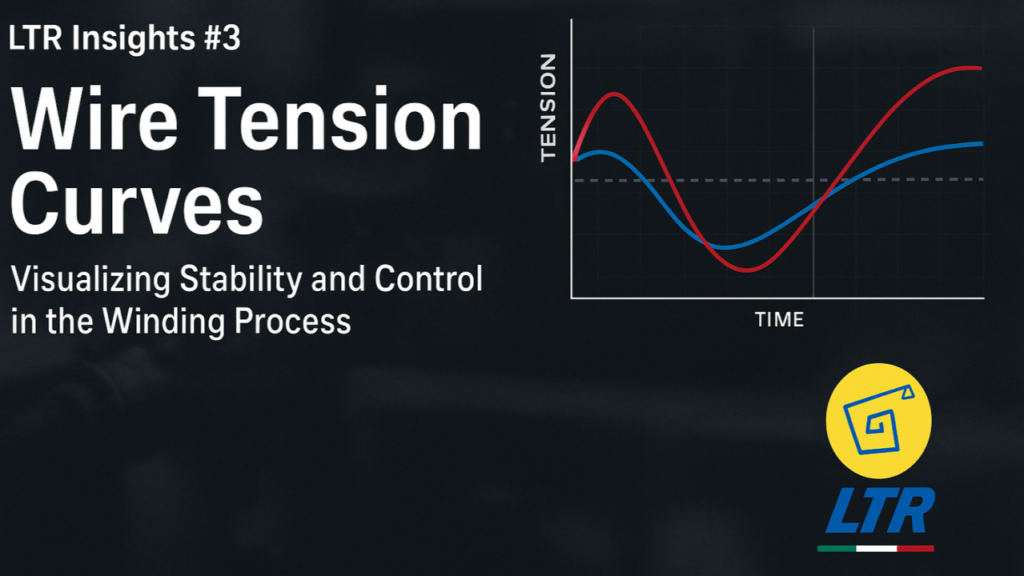
Article #3
28 October 2025
Introduction
In modern coil winding, seeing how wire tension behaves in real time provides engineers and operators with a deeper understanding of the process.
Through the visualization tools of LTR Communication Software, users can observe tension trends directly during winding, turning invisible dynamics into measurable and analyzable data.
This real-time representation transforms wire tension from a static parameter into a living signal, one that reveals the stability, responsiveness, and accuracy of the system.
What a Tension Curve Shows
A tension curve is a graphical representation of how the wire tension evolves over time. The horizontal axis represents time, while the vertical axis represents the measured tension value.
The graph typically shows three elements:
- A set point line, representing the desired wire tension.
- The actual tension curve, displaying the live measurement.
- Occasional spikes or oscillations, indicating process disturbances or control corrections.
By monitoring these curves, it becomes possible to assess whether the system maintains stability around the set point or if the tension fluctuates beyond acceptable limits.
Typical Behavior with Mechanical Tensioners
Mechanical tensioners rely on manually adjusted springs and friction systems. Because their control is purely mechanical and not closed-loop, their tension curve tends to show periodic oscillations as the system reacts to variations in spool diameter and wire speed.
These oscillations appear as gentle waves on the graph — an indication of the system’s natural inertia and delay in compensation.
While perfectly acceptable for stable, low-speed winding operations, these variations can affect layer consistency in more dynamic processes.
Typical Behavior with Electronic Tensioners
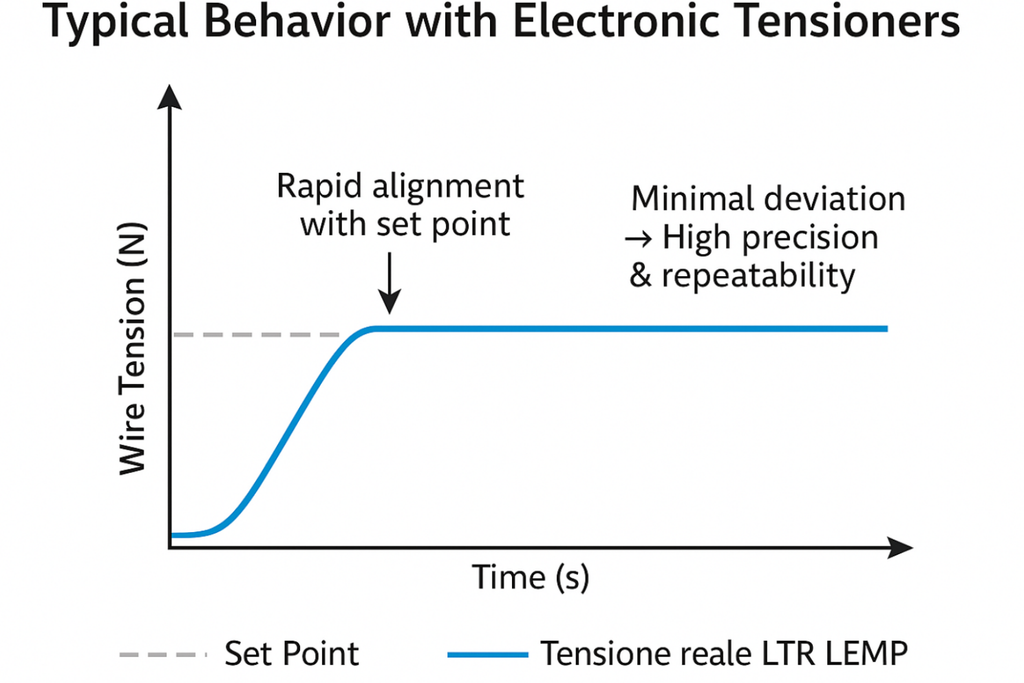
In contrast, electronic tensioners like the LTR LEMP Series operate within a closed-loop system.
The load cell continuously reads the actual tension value and instantly compares it with the set point defined by the operator. The braking force is then automatically increased or decreased to maintain the target tension.
In the graphical representation, this results in a flat, stable curve that quickly aligns with the set point and remains there with minimal deviation.
This stability directly translates into higher winding precision, reduced wire stress, and superior repeatability.
Real-Time Monitoring through LTR Software
The LTR software enables real-time connection with the tension control unit through RS485 or USB.
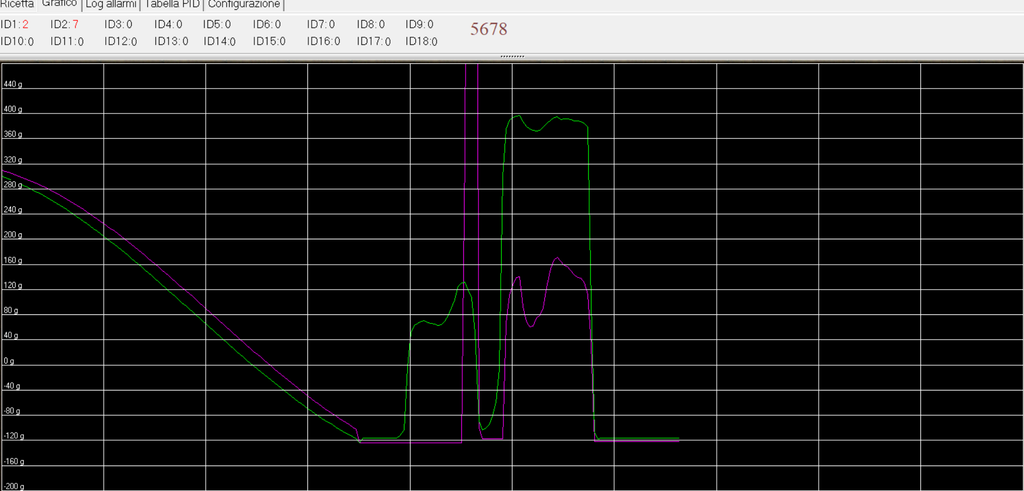
The operator can view the live tension signal during the winding process, together with the set point reference line.
This visual interface is more than just a monitoring tool, it’s an analytical instrument that helps identify transient phenomena, tune the control response, and ensure the system operates within its optimal range.
Alarm thresholds, if exceeded, are also recorded for process validation and maintenance purposes.
Interpreting the Graph: Stability and Control
The shape of the tension curve reveals the system’s dynamic behavior:
- Fast stabilization indicates a responsive and well-tuned control loop.
- Large oscillations suggest mechanical inertia or overcompensation.
- Flat, stable lines demonstrate perfect equilibrium between the wire feed and the braking force.
This visual insight allows technicians to diagnose system performance and optimize setup without additional hardware or complex analysis.
Comparative Representation
When comparing both technologies on a single graph:
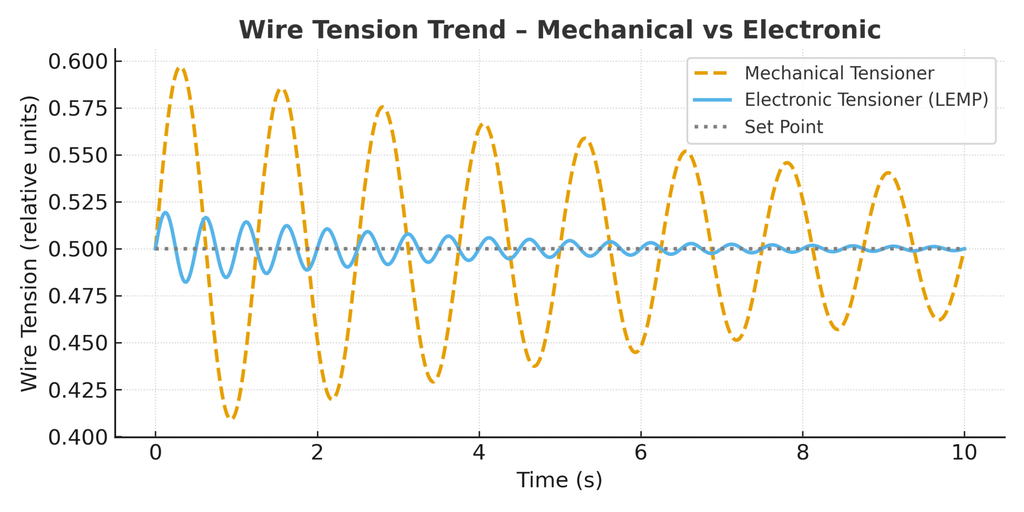
The mechanical tensioner curve appears as an oscillating wave around the target value.
The electronic tensioner curve stabilizes quickly and follows the set point line closely.
This simple yet powerful visualization captures the essence of precision control — transforming data into understanding.
Conclusion
The graphical representation of wire tension provides an invaluable perspective into the winding process.
Through LTR software, operators can monitor, analyze, and refine their setups in real time, ensuring the highest levels of consistency and reliability.
What once required experience and intuition can now be seen, measured, and improved through data.