
Article #8
4 June 2026
Turning Tension Data into Process Insight
Introduction
In modern winding processes, tension is no longer just a parameter to control, it is a source of valuable information.
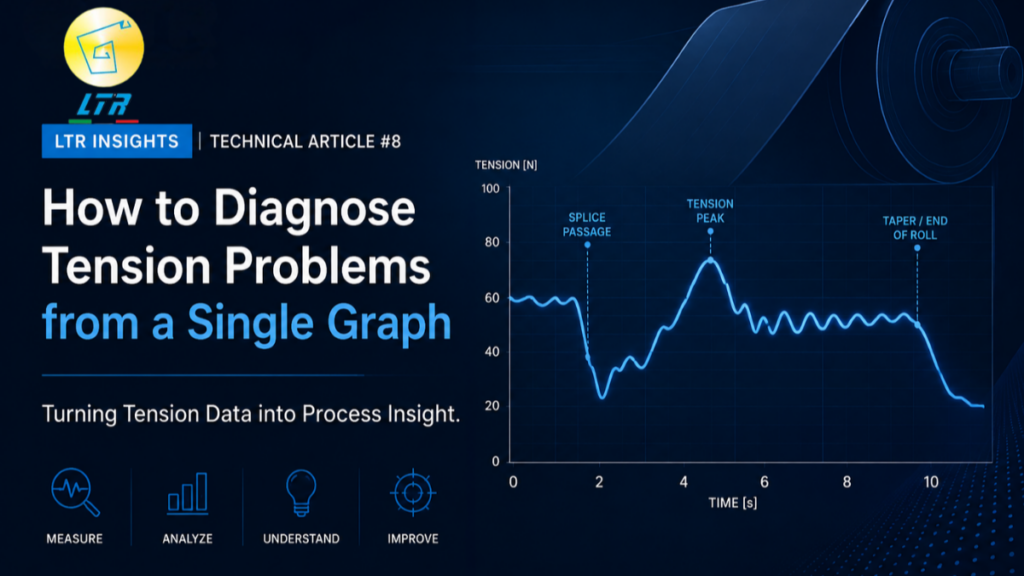
Every fluctuation, peak, drift, or oscillation recorded by a tension control system tells a story about what is happening inside the process.
For experienced engineers, a tension graph can reveal mechanical wear, friction issues, improper setup, unstable materials, or control-loop limitations long before defects become visible.
The challenge is learning how to interpret the signals correctly.
Why Tension Graphs Matter
Traditional tension measurements provide only a single value at a specific moment. A tension graph, on the other hand, provides a continuous picture of process behavior over time.
A process operating at the correct average tension can still generate scrap if the tension fluctuates excessively.
The Ideal Curve
In an optimized winding process, the tension signal remains close to the target value with only minor variations.
A stable curve indicates that the tension control system is effectively compensating for changes in spool diameter, speed, and material behavior.
Periodic Oscillations
One of the most common signatures found in tension graphs is a repetitive oscillation.
Typical causes include:
- Eccentric spools
- Damaged pulleys
- Rotating mechanical defects
- Periodic friction variations
Because the disturbance repeats at regular intervals, the waveform often appears sinusoidal.
Engineering Interpretation
If the oscillation frequency matches the rotational speed of a mechanical component, the source of the problem can often be identified quickly.
Progressive Drift
Sometimes the graph shows a slow increase or decrease in tension over time.
Possible causes include:
- Brake wear
- Thermal expansion
- Spool geometry changes
- Material property variations
Unlike oscillations, drift is gradual and can remain unnoticed for long periods.
Engineering Interpretation
Drift often indicates that the process is moving away from its original operating condition and may require recalibration or maintenance.
Sudden Peaks and Spikes
Short-duration peaks are among the easiest anomalies to recognize.
They are often generated by:
- Wire knots or joints
- Damaged material
- Abrupt speed changes
- Operator intervention
- Temporary obstructions in the wire path
Engineering Interpretation
Although brief, these events can produce localized defects, insulation damage, or wire breakage.
Excessive Signal Noise
A tension graph may appear highly irregular, even when no obvious defect is present.
Possible causes include:
- Unstable material feed
- Excessive mechanical vibration
- Insufficient damping
- Poorly tuned control parameters
Engineering Interpretation
High-frequency noise usually indicates that the system is constantly reacting to disturbances rather than controlling them smoothly.
From Data to Predictive Maintenance
The real value of tension graphs goes beyond troubleshooting.
When tension data is continuously recorded and analyzed, engineers can identify trends before failures occur.
This allows maintenance teams to intervene proactively instead of reacting after production issues appear.
Engineering Insight
From an engineering perspective, a tension graph is more than a visual representation, it is a dynamic fingerprint of the winding process.
By analyzing:
- Amplitude
- Frequency
- Standard deviation
- Long-term trends
engineers can quantify process stability and establish predictive maintenance thresholds.
In other words:
A tension graph does not simply show what happened. It helps predict what will happen next.
Conclusion
A single tension graph contains far more information than many operators realize.
When interpreted correctly, it becomes a powerful diagnostic tool capable of revealing hidden process issues, improving troubleshooting efficiency, and supporting predictive maintenance strategies.
The future of tension control is not only about maintaining a set point, it is about transforming process data into actionable engineering knowledge.
At LTR Winding Innovations, we help manufacturers leverage advanced tension control and data analysis technologies to achieve greater stability, repeatability, and process transparency.