
Article #4
14 November 2025
Introduction
In this fourth edition of LTR Insights, we move from the physical behavior of wire tension to the digital dimension of process monitoring. We’ll explore how data logging, trend visualization, and predictive maintenance enable deeper understanding and optimization of the winding process, especially when combined with LTR’s Communication Software and electronic tensioners.
From Control to Knowledge
Electronic tensioners already stabilize the winding process through closed-loop control. But by collecting and analyzing data in real time, engineers can transform each winding cycle into a source of information, detecting patterns, drifts, or anomalies before they affect production.
Key concepts introduced:
- Real-time monitoring (tension, speed, torque)
- Historical data storage
- Trend analysis over multiple runs
- Parameter traceability
Data Logging with LTR Communication Software
The LTR Communication Software allows operators to record every parameter related to tension control.
Data typically logged:
- Wire tension over time (T vs. t)
- Set point stability and corrections
- Alarm or warning events
Advantages:
- High-resolution sampling
- Exportable data for post-analysis
Trend Analysis and Diagnostics
By comparing curves across different production batches, engineers can detect:
- Early signs of mechanical wear or sensor drift
- Environmental influences (temperature, humidity)
- Operator setup deviations
This turns the tension curve into a diagnostic fingerprint of the machine’s health and consistency.
Predictive Maintenance
Combining data from multiple tensioners across production lines allows:
- Trend prediction → Identify slow drifts in response time or maximum force
- Threshold alerts → Automatic notification when tension exceeds expected range
- Preventive actions → Schedule brake replacement or recalibration before failure
LTR systems can be integrated into a factory’s Industry 4.0 environment, offering data through standard communication protocols (e.g., Modbus, RS-485, or TCP).
Engineering Insight
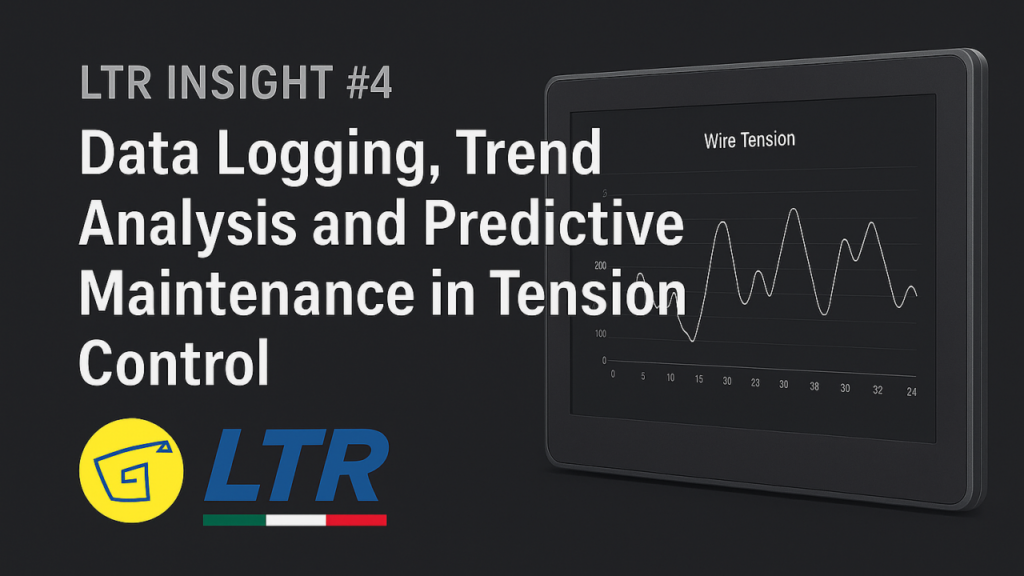
From an engineering point of view, the recorded tension curve is more than a simple trace, it’s a dynamic signature of the control system.
The deviation ΔT_response(t) reflects how quickly and accurately the system reacts to external variations (wire speed, spool diameter, or environmental effects).
A narrow, symmetric curve around the set point indicates a well-tuned feedback loop. An asymmetric or drifting curve may signal mechanical wear, brake hysteresis, or sensor lag.
By analyzing the statistical distribution of ΔT_response, for instance through standard deviation or frequency analysis, engineers can quantify stability and define predictive thresholds for maintenance.
Conclusion
In coil winding, maintaining consistent wire tension has always been a critical objective, but today, data visibility and traceability have become equally essential.
Through the integration of electronic tensioners, real-time monitoring, and LTR Communication Software, tension control is no longer a closed process: it is a continuous source of measurable knowledge.
Every recorded curve represents a history of system behavior, one that can be analyzed, compared, and used to anticipate future conditions.
By transforming raw data into actionable insight, engineers can achieve predictable quality, proactive maintenance, and long-term process optimization.
Data-driven tension control is not just a refinement of the process, it’s a step toward the digital transformation of winding operations, where performance, reliability, and intelligence coexist in perfect balance.